Turbine Engine Blade-off Test

Rolls Royce Engine Blade-off Test     Video Link 1     Video Link 2

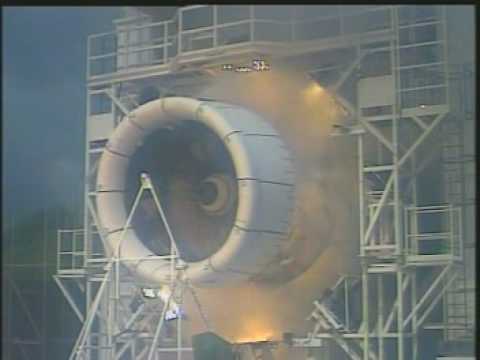
The engine blade-off test is performed to make sure that the engine can survive a fan. compressor or turbine blade breaking off within the engine, without fragments being ejected through the outside enclosure of the engine.  This is a containment requirement.

A fan blade is deliberately detached during the test using an explosive device while the engine is running at maximum thrust. The test does not require that the engine continues to operate after the blade failure.

The resulting blade loss causes a rotating imbalance force which can induce moderate to severe structural vibration.

For an actual flight occurrence, the engine would be shut down. There is no means of stopping the engine from continuing to rotate while there is sufficient airflow through the fan section to drive the engine. So it would continue to “windmill” without producing any thrust. The rotating imbalance vibration would persist under these conditions.

* * * * *

Here is a related video on the topic of fan blade loss…

Dr. David Ewins presentation excerpt

See: Exciting Vibrations: The Role of Testing in an Era of Supercomputers and Uncertainties

Go to 27:00 minute mark and watch for about six minutes

* * * * *

Fatigue accounts for a significant number of turbine and compressor blade failures and is promoted by repeated application of fluctuating stresses. Stress levels are typically much lower than the tensile stress of the material. Common causes of vibration in compressor blades include stator passing frequency wakes, rotating stall, surge, choke, inlet distortion, and blade flutter. In the turbine section, airfoils have to function not only in a severe vibratory environment, but also under hostile conditions of high temperature, corrosion, creep, and thermomechanical fatigue.   Reference

* * * * *

Flight Case Histories

AirAsia X Flight D7237, Airbus 330, Royce-Rolls Engines June 25, 2017
Video Link 1     Video Link 2

* * * * *

Southwest B737 near Pensacola on Aug 27th 2016, Uncontained Engine Failure
Report Link

Engine damage seen on the ground (Photo: Peter Lemme)

* * * * *

Thomas Cook Airline, Airbus A330, Rolls Royce Engines, Turbine Blade Fails
Manchester Airport UK, Monday 24 June 2013.   Video Link   Report Link

The blade failure was caused by high cycle fatigue (HCF) crack propagation with crack initiation resulting from ‘Type 2 sulphidation’ corrosion.

* * * * *

Qantas Boeing 747-400 near Singapore on May 9th 2011, Fatigue Fracture of Blade 24

The fatigue fracture of blade 24 (Photo: ATSB)

Article Link

The engine was removed and sent for further analysis. Disassembly revealed only minor damage to internal components. The root of the fractured blade was removed and sent for laboratory analysis. The analysis revealed the blade had fractured as result of growth of a low stress/high cycle fatigue crack.

See also:  AC 25-24 – Sustained Engine Imbalance

– Tom Irvine

Fatigue Analysis Webinars

Ritchey_ti2

This is a work-in-progress…

The fatigue units are available to students who enroll in the Shock & Vibration course series.

__________________________________________________________________

M.H.A. Bonte, A. de Boer, R. Liebregts, Prediction of mechanical fatigue caused by multiple random excitations:  stress_psd_1.pdf

Dr.-Ing. Marinus Luegmair, Dr.-Ing. Alexander Ziehl, Von Mises Stress PSD using MSC.Random:  stress_psd_2.pdf

__________________________________________________________________

– Tom Irvine

Tom’s Conference Papers & Slide Index

I am trying to collect all my presentations. This is a work-in-progress…

Thank you,
Tom Irvine

* * * * * *

NAFEMS World Congress 2017

Introduction to Vibration

Spectral Functions

Random Vibration

Vibration Fatigue

Shock 1 & 2

Videos

* * * * * *

Aerospace Spacecraft & Launch Vehicle (SCLV) Dynamic Environments Conference

2018, Avionics Component FEA Shock Analysis

2017, Statistical Energy Analysis Software & Training Materials, Part 2

2016, Statistical Energy Analysis Software & Training Materials

2015, Seismic Analysis and Testing of Launch Vehicles and Equipment using Historical Strong Motion Data Scaled to Satisfy Shock Response Spectra Specifications

2014, Optimized PSD Envelope for Nonstationary Vibration  &  Alternate link

2013, Extending Steinberg’s Fatigue Analysis of Electronics Equipment to a Full Relative Displacement vs. Cycles Curve

2012,  Keynote, Dynamics Engineering: A Call to Serve  

2012, An Alternate Damage Potential Method for Enveloping Nonstationary Random Vibration

2011, The NASA Engineering & Safety Center (NESC) Shock & Vibration Training Program

* * * * * *

European Space Agency

2015, ESA-ESTEC

ESA Pyrotechnic Shock Distance & Joint Attenuation via Wave Propagation Analysis

ESA Shock Analysis of Launch Vehicle Equipment using Historical Accelerometer Records to Satisfy Shock Response Spectra Specifications 

2016, European Conference on Spacecraft Structures Materials and Environmental Testing

Modifying Spectral Fatigue Methods for S-N Curves with MIL-HDBK-5J Coefficients

* * * * * *

Various Vibration & Fatigue Conferences

VAL2015, A review of spectral methods for variable amplitude fatigue prediction and new results

VAL 2015, Using a Random Vibration Test Specification to Cover a Shock Requirement via a Pseudo Velocity Fatigue Damage Spectrum

ICoEV 2015, International Conference on Engineering Vibration, Derivation of Equivalent Power Spectral Density Specifications for Swept Sine-on-Random Environments via Fatigue Damage Spectra

ICoEV 2015, Comparison of Fatigue Cycle Identification Methods

MOVIC & RASD 2016, Multiaxis Fatigue Method for Nonstationary Vibration

* * * * * *

Shock and Vibration Exchange (formerly SAVIAC)

2015, Shock Response Spectra & Time History Synthesis

2014, Rainflow Cycle Counting for Random Vibration Fatigue Analysis  

* * * * * *

Institute of Environmental Sciences and Technology (IEST)

ESTECH 2016, Nonstationary Vibration Enveloping Method Comparison

* * * * * *

Earthquake Engineering Conferences

16th WCEE, Seismic Analysis and Testing of Equipment using Historical Strong Motion Data Scaled to Satisfy Shock Response Spectra Specifications

* * * * * *

AIAA

2003, A Time Domain, Curve-Fitting Method for Accelerometer Data Analysis

2003, Practical Application of the Rayleigh-Ritz Method to Verify Launch Vehicle Bending Modes

* * * * * *

Miscellaneous

Nonstationary Vibration Enveloping Method Comparison

There is a need to derive a power spectral density (PSD) envelope for nonstationary acceleration time histories, including launch vehicle data, so that components can be designed and tested accordingly.

Three methods are considered in the following paper using an actual flight accelerometer record.

The first method divides the accelerometer data into segments which are idealized as “piecewise stationary” in terms of their respective PSDs. A maximum envelope is then drawn for the superposition of segment PSDs. This method initially requires no assumptions about the response characteristics of the test item, but vibration response spectra may used for peak clipping as shown in the example.

The following two methods apply the time history as a base input to a single-degree-of-freedom system with variable natural frequency and amplification factors. The response of each system is then calculated. Upper and lower estimates of the amplification factor can be used to cover uncertainty.

The first of this pair is the energy response spectrum (ERS), which gives energy/mass vs. natural frequency, as calculated from the relative response parameters.

The final method is the fatigue damage spectrum (FDS), which gives a Miners-type relative fatigue damage index vs. natural frequency based on the response and an assumed fatigue exponent, or upper and lower estimates of the exponent.

The enveloping for each of the response spectra methods is then justified using a comparison of candidate PSD spectra with the measured time history spectra. The PSD envelope can be optimized by choosing the one with the least overall level which still envelops the accelerometer data spectra, or which minimizes the response spectra error.

This paper presents the results of the three methods for an actual flight accelerometer record. Guidelines are given for the application of each method to nonstationary data. The method can be extended to other scenarios, including transportation vibration.

Paper:  enveloping_comparison.pdf

Slides:  Irvine_IEST_2016.pptx

The Matlab scripts for the enveloping methods are included in  Vibrationdata GUI package

* * *

See also:

Rainflow Cycle Counting

Energy Response Spectrum

Dirlik Rainflow Counting Method from Response PSD

Fatigue Damage Spectrum, Frequency Domain

Optimized PSD for Nonstationary Vibration Environments

– Tom Irvine

Optimized PSD Envelope for Multiple Accelerometer Time Histories

Prerequisite Reference Papers

David O. Smallwood, An Improved Recursive Formula for Calculating Shock Response Spectra, Shock and Vibration Bulletin, No. 51, May 1981.  DS_SRS1.pdf

Rainflow Counting Tutorial

Fatigue Damage Spectrum, Time Domain

Fatigue Damage Spectrum

Dirlik Method for PSDs

Optimized PSD FDS Nonstationary 

* * *

Main Paper

Consider a component mounted on a structure where the base input is measured by an adjacent accelerometer on the structure. An envelope power spectral density (PSD) is needed so that component design and test levels can be derived, with the appropriate added statistical uncertainty margin.

Assume that the base input has been measured over a series of accelerometer time histories. This could be the case for an automobile driven at different speeds over different road conditions, for example.

The envelope PSD can be derived using fatigue damage spectra as shown in:  FDS_PSD_multiple.pdf

The C++ programs are:

fds_multiple.cpp
fds_multiple.exe
fds_multiple_envelope.cpp
fds_multiple_envelope.exe

* * *

Here is an alternate program that allows for repetition for a given time history file.  This is useful, for example, if a short time duration was measured to represent a longer service duration.

fds_multiple_alt.cpp
fds_multiple_alt.exe

Now assume that there are three measured acceleration time histories where the repetition number is 10, 50 and 100, respectively.

The input file format would be:

time_history_1.txt 10
time_history_2.txt 50
time_history_3.txt 100

Substitute your own file names and multipliers accordingly.

* * *

– Tom Irvine

Fatigue Damage including Mean Stress

Options for including mean stress have been added to the Vibrationdata GUI package’s Fatigue Toolbox, for both stress time histories and PSDs.

Four methods are available:

Gerber
Goodman
Morrow
Soderberg

Matlab script: Vibrationdata Signal Analysis Package

Here are some charts from Iowa State University: Fatigue Mean Stress

– Tom Irvine

NASGRO Coefficients

The following scripts calculate the A, B, C, P coefficients to model a set of SN curves with varying R values: sin_curve_fit_R.zip

sn_curve_fit_R.m is the main script.

The remaining scripts are supporting functions.

The equations are given in: sn_curvefit_equation.pdf

* * *

References:

1. MIL-HDBK-5J

2. NASGRO NASFORM manual

* * *

– Tom Irvine

Webinar 37 – Acoustic Fatigue

PowerPoint Slides:  webinar_37_acoustic_fatigue.pptx

Audio/Visual File:

NESC Academy Acoustic Fatigue – Recommend viewing in Firefox with Sliverlight Plugin

* * *

References:

Rainflow Fatigue Posts

Acoustic Fatigue of a Plate

Acoustic Power Spectra

* * *

Matlab script: Vibrationdata Signal Analysis Package

* * *

See also: Vibrationdata Webinars

Thank you,

Tom Irvine

Low Risk Parts for Spaceflight

NASA-STD-5019, Fracture Control Requirement for Spaceflight Hardware (excerpt)

4.1.1.12 Low-Risk Part

This section addresses parts that can be classified non-fracture critical because of large structural margins and other considerations that make failure from a pre-existing flaw extremely unlikely.

a. For a part to be classified low risk, it shall be constructed from a commercially available material procured to an aerospace standard or equivalent.

b. Aluminum parts shall not be loaded in the short transverse direction if this dimension is greater than 7.62 cm (3 in).

c. A part whose failure directly results in a catastrophic hazard shall be excluded from being classified low risk, except when the total (unconcentrated) stresses in the part at limit load are less than 30 percent of the ultimate strength for the material used and requirements (1) through (3) and either (4) or (5) are met.

d.  If there is a change in loads, parts classified as low risk shall be re-evaluated to ensure
that net section stresses remain below 30 percent of ultimate strength. 

* * *

The peak stress can also be compared to the endurance limit, but some materials do not have identified endurance limits.  Here is a rule-of-thumb for these cases from NASA-HDBK-5010.

Perform endurance limit analysis to show the maximum stress does not exceed the endurance limit or

Smax < Ftu/( 4{1-0.5 R} )

where

Smax is the local concentrated stress
Ftu is the tensile ultimate stress
R is the ratio of minimum stress to maximum stress in a fatigue cycle

Note that R=-1 for fully reversed stress with zero mean stress.  For this case:  Smax < Ftu/6

This formula has some limitations and needs further research.

* * *

– Tom Irvine