Compression after Impact Testing of Composite Laminates Specimens


Figure 1.  Boeing 787 Aircraft

Carbon fiber/epoxy laminates are widely used in aeronautic and aerospace structural components mainly because of their excellent specific mechanical properties.  These laminates show mechanical properties similar or higher than the conventional metallic materials in terms of strength-to-weight and stiffness-to-weight ratios.  The laminates also have higher corrosion resistance.

But the composite laminates may suffer damage during their manufacture, assembly, maintenance or service life, caused by different types of impact, of which low-energy impact is considered the most dangerous because it may not be apparent in a routine visual inspection of the impacted surface.

The impact could result from something as simple as a technician dropping a tool on the laminate surface or from flying debris.

Delamination within composite components is probably the most serious problem, given the difficulty of its visual detection and the extent to which it lowers the mechanical properties. The greatest reduction is that of the compression strength which may be reduced by 60% relative to an undamaged component’s strength.

So damage tolerance is an important factor in the design of aeronautic and aerospace components made of laminated materials. Damage tolerance in laminates is usually studied by determining the effect of different impact energies on their residual strength. The compression after impact (CAI) test is used to test components damaged by low energy impact.

There is a two-step test for assessing potential damage to laminates using small specimen plates.  The first step is do induce damage using an impact.  This is followed by a compression test of the damaged specimen.


Figure 2.  Specimen Mounted in Fixture prior to Drop Weight Impact Damage

itest

Figure 3.   Zwick/Roell HIT230F Drop Weight Tester – Pre-damaging Fiber Composites for CAI Tests

Most of the tests to generate laminate damage are done with a drop weight tower testing device that reproduces the impact of a large mass at relatively low velocity (a few meters per second).  The test machine in Figure 3 can apply impacts with energy levels up to 230 Joules (170 foot-pounds force).

The size of the specimen and the clamping system vary from one study to another but the devices and the procedures are similar.

cai

Figure 4.  Specimen Compression Test

The CAI test measures the residual strength of a composite laminate after being damaged by impact.  The CAI fixture has adjustable side plates to accommodate for both variations in thickness and overall dimension.  The fixture was originally designed by Boeing and outlined in specification BSS 7260.   The fixture with the specimen is tested in either an electromechanical or servohydraulic test machine.  The compression load is increased until the specimen fails.  The typical failure mode is progressive delamination between plies with local buckling.

The CAI fixture frame is designed so that the specimen does not undergo global buckling. The frames vary according to the standard:

  • ASTMBoeingSACMA and DIN: All four sides are guided, but not gripped.
  • ISO, EN and Airbus standards: The upper and lower ends of the specimen are gripped. The sides are guided with linear contact.

* * * * *

Reference:   Compression after Impact of Thin Composite Laminates

ASTM D7136 / D7136M – 15
Standard Test Method for Measuring the Damage Resistance of a Fiber-Reinforced Polymer Matrix Composite to a Drop-Weight Impact Event

ASTM D7137 / D7137M – 12
Standard Test Method for Compressive Residual Strength Properties of Damaged Polymer Matrix Composite Plates

Boeing, Advanced composite compression test. Boeing Specification Support Standard BSS 7260; 1988.

NASA-STD-5019A, NASA Technical Specification: Fracture Control Requirements for Spaceflight Hardware

Nettles, Damage Tolerance of Composite Laminates from an Empirical Perspective

DOT/FAA/AR-10/6, Determining the Fatigue Life of Composite Aircraft Structures Using Life and Load-Enhancement Factors

* * * * *

Composite Material Fatigue Notes

composite_fatigue

Examples of failures following fatigue testing: (a) positive stress ratio (R = 0.05) and (b) negative stress ratio (R = -0.5).

The tensile ultimate strength obtained for woven balanced bidirectional laminated carbon/epoxy composites is significantly higher (about 69%) than the compressive ultimate strength. Under tensile loading the composites exhibit brittle behavior, while in compressive tests some nonlinear behavior was observed, which may be consequence of progressive fiber buckling.

P.N.B. Reis, J.A.M. Ferreira, J.D.M. Costa, M.O.W. Richardson, Fatigue life evaluation for carbon/epoxy laminate composites under constant and variable block loading, Composites Science and Technology 69 (2009) 154–160    Link

* * * * *

The stress ratio   R = (min stress)/(max stress)

Rosenfeld and Huang conducted a fatigue study with different stress ratios to determine the failure mechanisms under compression of graphite/epoxy laminates and showed that Miner’s rule fails to predict composite fatigue under spectrum loading.

Rosenfeld, M.S. and Huang, S.L., “Fatigue Characteristics of Graphite/Epoxy Laminates Under Compression Loading,” Journal of Aircraft, Vol. 15, No. 5, 1978, pp. 264-268.

* * * * *

A study conducted by Agarwal and James on the effects of stress levels on fatigue of composites confirmed that the stress ratio had a strong influence on the fatigue life of composites. Further, they showed that microscopic matrix cracks are observed prior to gross failure of composites under both static and cyclic loading.

Agarwal, B.D. and James, W.D., “Prediction of Low-Cycle Fatigue Behavior of GFRP: An Experimental Approach,” Journal of Materials Science, Vol. 10, No. 2, 1975, pp. 193-199.

* * * * *

Reference

Fatigue Failure in Fiber Reinforced Laminate Composites

  • matrix cracking
  • fiber fracture
  • fiber/matrix debonding
  • ply cracking
  • delamination
  • combined effects

* * * * *

– Tom Irvine

Sine Sweep vs. Random for Pre and Post Testing

19_fuel-cell-vibration-test

Certain equipment must be designed and tested to withstand vibration.  This is common in the automotive, aerospace, military and other industries.    The equipment is typically mounted to a shaker table and then subjected to a base input random or sine sweep vibration test.   The random vibration is usually in the form of a power spectral density (PSD).

The sine sweep or random test level may represent a maximum expected field environmental, a parts and workmanship screen, or an envelope of both.   The level may also include a statistical uncertainty margin or a safety factor.

A common practice is to perform low-level sine sweep test before and after the full-level test in order to measure the transmissibility ratio and identify natural frequencies and damping ratios.   There must be at least one base input control accelerometer and one reference accelerometer for this test, where the reference accelerometer is mounted somewhere on the test item.   The before and after transmissibility curves are then compared to assess whether any of the response peaks have shifted in frequency or magnitude.   Any shift may indicate that some fasteners have loosened or some other change has occurred.  If so, further investigation is needed.  Ideally, two curves are identical such that no further evaluation is required.

Sine sweep is the traditional vibration test for the pre and post tests.  The purpose of this paper is to determine whether random vibration can be substituted for sine sweep, via an example.  This could be done for time saving.  Also, random vibration is easier to control than sine sweep.

A difference between sine sweep and random is that all modes are excited all the time for stationary broadband random.  There is only one excitation frequency at a given time in sine sweep vibration, and each mode will be excited individually if the modal frequencies are well-separated.  In addition, the random vibration used for shaker testing typically has a bell-shaped histogram curve, whereas sine sweep vibration with constant amplitude has a bathtub-shaped histogram.

Both sine sweep and random should give the same transmissibility results for a linear system per textbook theory, but there are some practical concerns for implementation of each.  The numerical example results will show that random vibration is adequate, although sine sweep remains the best choice because it can give finer resolution.

An example is given in:  sine_sweep_random_pre&post_test.pdf

See also:

Webinar Unit 3 Sine Sweep Vibration 

Beam Bending Natural Frequencies & Mode Shapes

– Tom Irvine

Multi-axis Shock & Vibration Testing

Equipment must be designed and tested to withstand shock and vibration.  Ideally, all equipment would be tested on a shaker table with six-degree-of-freedom control (three translations and three rotations).  Such tables and control systems exist but are very expensive.  Furthermore, any multi-axis testing requires careful consideration of phase angles between the six degrees.

Another option is to test equipment on a triaxial table where the three translations are controlled, and the three rotational degrees are constrained to zero motion.  Testing on a biaxial table is yet another choice.

The most common test method, however, remains testing in each of three orthogonal axes, one axis at a time, on a single-axis shaker.  This is simplest and least expensive method.

The question arises “Should the acceleration level be increased for the case of single-axis testing?”

There is a tacit understanding that aerospace and military equipment test levels already have a sufficient uncertainty margin or safety factor so that the levels can be used without further increase.  In other words, the specifications are already intended for single-axis testing.  In many cases, a uniform level is used in each axis which is the maximum envelope of the maximum expected levels in the three axes plus some margin.

* * *

The standards which address testing equipment for earthquakes take a different approach. The following descriptions are taken from five common standards.

Only KTA 2201.4 gives a scaling formula.  This is also the only standard from the five samples which may be freely downloaded.

* * *

IEEE 344-2013  Standard for Seismic Qualification of Equipment for Nuclear Power Generating Stations

8.6.6 Multiaxis tests

Seismic ground motion occurs simultaneously in all directions in a random fashion. However, for test purposes, single-axis, biaxial, and triaxial tests are allowed. If single-axis or biaxial tests are used to simulate the 3D environment, they should be applied in a conservative manner to account for the absence of input motion in the other orthogonal direction(s). One factor to be considered is the 3D characteristics of the input motion. Other factors are the dynamic characteristics of the equipment, flexible or rigid, and the
degree of spatial cross-coupling response. Single and biaxial tests should be applied to produce adequate levels of excitation to equipment where cross coupling is significant and yet minimize the level of overtesting where the cross coupling is not significant.

* * *

KTA 2201.4   Design of Nuclear Power Plants against Seismic Events, Part 4: Components

This document may be freely downloaded: link

See paragraphs

5.3.3 Excitation Axes

5.5.2.5 Simultaneity of excitation directions

Simultaneous three-axis testing is preferred. But single-axis testing can be substituted by testing in each of three axes sequentially.

The standard shows, for example, that the uniform single-axis level should be the “square root of the sum of the squares” of the three orthogonal installation site levels.

* * *

IEC 980 Recommended practices for seismic qualification of electrical equipment of the safety system for nuclear generating stations

6.2.9 Qualification test method

6.2.9.1 General

As is well known, seismic excitation occurs simultaneously in all directions in a random way. According to this point of view, the test input motion should consist of three mutually independent waveforms applied simultaneously along the three orthogonal axes of the equipment.

However, taking into account that three axial testing installations are rare and that triaxial testing is desirable when significant coupling exists simultaneously between the two preferred horizontal axis of the specimens, biaxial testing with multifrequency independent input motion in the horizontal and vertical direction is an acceptable test.

Tests shall be performed according to 6.3.2 and, in terms of total duration and fatigue induced, are intended to become conservative.

In some cases, single axis tests with multiple, or single frequency excitation are also acceptable methods of test if properly justified considering the effect of coupling between axes.

* * *

Telcordia GR-63-CORE

Assumes single-axis testing.  The base input time history is specified in the standard.

* * *

IEEE 693-2005 – IEEE Recommended Practice for Seismic Design of Substations

paragraph 4.9

The shaker table shall be biaxial with triaxial preferred.

* * *

See also:

Seismic Test & Analysis Webinars

Hypersphere SRS


– Tom Irvine

Seismic Test & Analysis Webinars

This is a work-in-progress…

I am creating a series of webinars with Matlab exercises for seismic testing.

Here are the slides.

Telcordia Technologies Generic Requirements GR-63-CORE:  Bellcore_GR_63_Core.ppt
This unit contains an alternative waveform for VERTEQII.

CEI.IEC 980, Recommended practices for seismic qualification of electrical equipment of the safety system for nuclear generating stations:  CEI/IEC 980: 1989

IEEE Std 693-2005, Recommended Practice for Seismic Design of Substations: IEEE_693_sine_beat.pptx

IEEE Standard for Seismic Qualification of Equipment for Nuclear Power Generating
Stations: IEEE_std_344.ppt

Matlab script: Vibrationdata Signal Analysis Package

* * *

See also:

Cummins Generator Seismic Shaker Test

Earthquake Conference

Seismic Shock

Webinar 47 – Shock Response Spectrum Synthesis, Special Topics

Seismic Peak Ground Acceleration

Some Earthquake Engineering Terminology

* * *

– Tom Irvine

Satellite Equipment Vibration Testing

stentor__1

Stentor Satellite

Equipment mounted in satellites must withstand acoustic-driven random vibration at liftoff and during the transonic and maximum dynamic pressure phases of flight.   The equipment must be designed and test accordingly.

The equipment is mounted on shaker tables for the random vibration testing, but this can be overly conservative with respect to the actual vibroacoustic environment.

Here is an interesting case study paper:

Comparison of Satellite Equipment Responses Induced by Acoustic and Random Vibration Tests, Bertrand Brevart, Alice Pradines, 2002. Comparison_Satellite_2002.pdf

Force-limiting is one method for mitigating this overtest problem.  See NASA-HDBK-7004

More later…

– Tom Irvine

Some Nonlinear Sine Sweep Vibration Test Data

Certain equipment must be designed and tested to withstand external vibration excitation.  This is common in the military, naval, aerospace and other industries.

The equipment is typically mounted on a shaker table and subjected to base excitation.  The input may be random vibration if the field environment is likewise.  In other cases, random vibration is used to verify the integrity of parts and workmanship separately from the maximum expected field environment.

The random vibration is typically specified as a power spectral density (PSD).  Note that the workmanship screen and field level can be enveloped by a single PSD. A goal is to verify that the equipment operates properly before, during and after the random vibration test.

A more thorough test is to perform a sine sweep test before and after the random vibration test.   A response accelerometer is mounted on the test article, in addition to the control accelerometer at the base input location.   The objective is to determine whether any natural frequencies have shifted, or any other changes have occurred, as a result of the random test.  Such changes could indicated loosened fasteners, crack formation or other defects.

A case history is given next.  The data was sent to me by a colleague.  I have requested further information on the equipment and will post a photo or diagram later if permission is granted.

sine_sweep_nonlinearity

Figure 1.

sine_sweep_fft
Figure 2.

A rocket engine assembly was subjected to a sine sweep test in conjunction with a random test.  A resonant response occurred when the excitation frequency was swept through 85 to 86 Hz as shown in Figure 1.  The equipment response would have had a similar frequency content to the input if it had been a well-behaved, linear, single-degree-of-freedom system.  The response Fourier transform for the corresponding duration did have a spectral peak at 85.45 Hz matching the sweeping input frequency as shown in Figure 2.

(Note that this is an approximation because the Fourier transform is taken over a short duration and represents an average, whereas the input frequency has instantaneous change.)

But the response also showed integer harmonics with the highest peak at 683.6 Hz, which was 8x the fundamental frequency.

Please let me know if you have observed similar effects or have other insights.  Hopefully, I can post more details later…

Sine Sweep Time History Data

Thank you,
Tom Irvine

* * *

My colleague Albert Turk sent me a reply, paraphrased as follows:

I suspect a component with a resonance at the input frequency that is excited to the point of metal-to-metal impact. I have seen data from repetitive impact machines (HASS) and also from gunfire (50 cps) that had these integer multiples.

If so, the sinusoidal excitation has turned the assembly into a repetitive impact machine near 85 Hz. It would be interesting to see if there is a sine input amplitude threshold below which this suddenly goes away.

And Steve Zeise wrote:

I have observed this phenomenon and tracked it down to loose joints introducing impacts into the system.

Note that joints can slip under shock & vibration loads.

“Loss of clearance” of “loss of sway space” may be appropriate, related terms to describe the problem shown in the data.  Further investigation is needed.

JPL Tunable Shock Beam

jpl_shock2

jpl_shock3

jpl_shock5

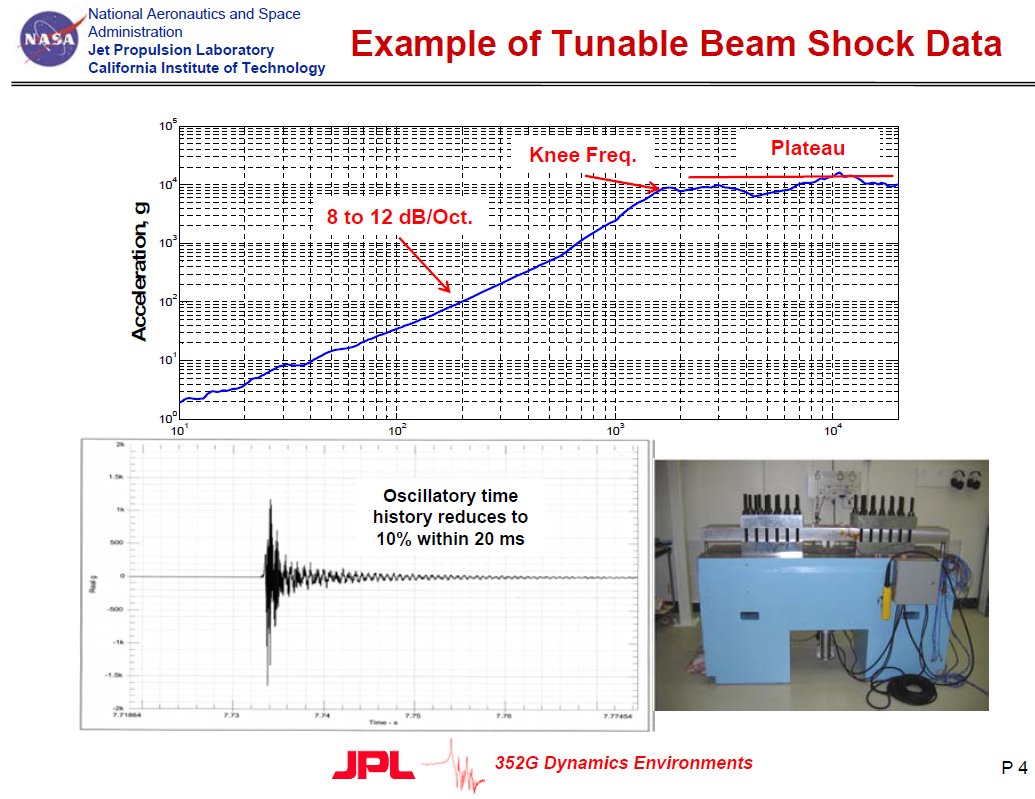
The NASA/JPL Environmental Test Laboratory (ETL) developed and built a tunable beam shock test bench based on a design from Sandia National Laboratory many years ago. ETL has been using this test system successfully since October 2008.

The excitation is provided by a projectile driven by gas pressure.

The beam is used to achieve shock response spectrum (SRS) specifications, typically consisting of a ramp and a plateau in log-log format. The intersection between these two lines is referred to as the “knee frequency.” The beam span can be varied to meet a given knee frequency. The high frequency shock response is controlled by damping material.

The tunable-beam system is calibrated with a center-of-gravity (CG) mass and footprint model of the test article. The mass simulator is mounted in the test axis with the appropriate accelerometers installed as they would be for the testing the test article. Then the system is tuned by performing test runs until the data plots meet the requirement.

Finally, the test article is mounted to the tuned beam for the actual test.

See also:  JPL Tunable Beam

– Tom Irvine

Nonstationary Vibration Enveloping Method Comparison

There is a need to derive a power spectral density (PSD) envelope for nonstationary acceleration time histories, including launch vehicle data, so that components can be designed and tested accordingly.

Three methods are considered in the following paper using an actual flight accelerometer record.

The first method divides the accelerometer data into segments which are idealized as “piecewise stationary” in terms of their respective PSDs. A maximum envelope is then drawn for the superposition of segment PSDs. This method initially requires no assumptions about the response characteristics of the test item, but vibration response spectra may used for peak clipping as shown in the example.

The following two methods apply the time history as a base input to a single-degree-of-freedom system with variable natural frequency and amplification factors. The response of each system is then calculated. Upper and lower estimates of the amplification factor can be used to cover uncertainty.

The first of this pair is the energy response spectrum (ERS), which gives energy/mass vs. natural frequency, as calculated from the relative response parameters.

The final method is the fatigue damage spectrum (FDS), which gives a Miners-type relative fatigue damage index vs. natural frequency based on the response and an assumed fatigue exponent, or upper and lower estimates of the exponent.

The enveloping for each of the response spectra methods is then justified using a comparison of candidate PSD spectra with the measured time history spectra. The PSD envelope can be optimized by choosing the one with the least overall level which still envelops the accelerometer data spectra, or which minimizes the response spectra error.

This paper presents the results of the three methods for an actual flight accelerometer record. Guidelines are given for the application of each method to nonstationary data. The method can be extended to other scenarios, including transportation vibration.

Paper:  enveloping_comparison.pdf

Slides:  Irvine_IEST_2016.pptx

The Matlab scripts for the enveloping methods are included in  Vibrationdata GUI package

* * *

See also:

Rainflow Cycle Counting

Energy Response Spectrum

Dirlik Rainflow Counting Method from Response PSD

Fatigue Damage Spectrum, Frequency Domain

Optimized PSD for Nonstationary Vibration Environments

– Tom Irvine

Optimized PSD Envelope for Multiple Accelerometer Time Histories

Prerequisite Reference Papers

David O. Smallwood, An Improved Recursive Formula for Calculating Shock Response Spectra, Shock and Vibration Bulletin, No. 51, May 1981.  DS_SRS1.pdf

Rainflow Counting Tutorial

Fatigue Damage Spectrum, Time Domain

Fatigue Damage Spectrum

Dirlik Method for PSDs

Optimized PSD FDS Nonstationary 

* * *

Main Paper

Consider a component mounted on a structure where the base input is measured by an adjacent accelerometer on the structure. An envelope power spectral density (PSD) is needed so that component design and test levels can be derived, with the appropriate added statistical uncertainty margin.

Assume that the base input has been measured over a series of accelerometer time histories. This could be the case for an automobile driven at different speeds over different road conditions, for example.

The envelope PSD can be derived using fatigue damage spectra as shown in:  FDS_PSD_multiple.pdf

The C++ programs are:

fds_multiple.cpp
fds_multiple.exe
fds_multiple_envelope.cpp
fds_multiple_envelope.exe

* * *

Here is an alternate program that allows for repetition for a given time history file.  This is useful, for example, if a short time duration was measured to represent a longer service duration.

fds_multiple_alt.cpp
fds_multiple_alt.exe

Now assume that there are three measured acceleration time histories where the repetition number is 10, 50 and 100, respectively.

The input file format would be:

time_history_1.txt 10
time_history_2.txt 50
time_history_3.txt 100

Substitute your own file names and multipliers accordingly.

* * *

– Tom Irvine

Relative Displacement from Two Accelerometer Time Histories

Assume that input and response acceleration PSDs have been measured.  The corresponding displacement PSDs can be readily calculated.

But the relative displacement cannot be calculated accurately because the phase angles are discarded in the PSD calculation.

The best method is to perform the relative displacement calculation in the time domain. The relative displacement PSD can then be calculated if desired.

The first step is to calculate the relative acceleration in the time domain.  Then integrations are performed to calculate the relative velocity and the relative displacement.  Highpass filtering and trend removal are optional steps in this process.

A function for calculating the relative displacement from two accelerometer time histories is given in:

Matlab script: Vibrationdata Signal Analysis Package

The function can be accessed via:

>> vibrationdata > Time History > Integrate or Differentiate >  Relative Displacement from Two Acceleration Time Histories

Typically, a highpass filter from 5 to 10 Hz is needed.

* * *

– Tom Irvine